Toxic Release Inventory (TRI) Toxic Trends Mapper
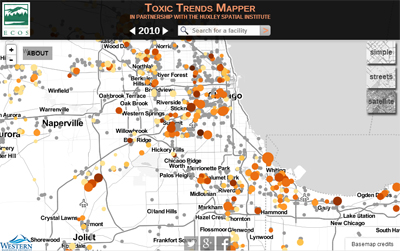
Chicago Metropolitan area. Circle size
represents the total pounds of stack
emissions, while color represents
the associated risk
Project Overview
This application combines data from the EPA’s Toxics Release Inventory and the Risk Screening Environmental Indicators (RSEI) program to display air pollution levels for individual facilities on a map of the United States along with their simulated risk-related score, broken out by pollution source. It is designed to provide ordinary citizens access to toxic pollution data regarding environmental releases from medium to large pollution sources like local refineries and aluminum smelters. The project grew out of research by the Spatial Institutes affiliated faculty member Dr. Troy Abel as outlined in his coauthored book, ‘Coming Clean.’ The book is an analysis of one of the oldest environmental information disclosure programs, the EPA’s Toxics Release Inventory. This project was designed to provide more data than the EPA releases as well as making the information readily available on any smart phone or web browser.
Before the Toxic Trends application, risk screening data was only provided through a desktop application created by the RSEI program. This applications installer needed to be downloaded from the web and was over 1GB in size. Additionally, while the data in the application was updated yearly, the application itself was built using old technology and has not seen a major update in many years. This made the installation fairly difficult on modern versions of the Windows operating system (the application does not run on Mac or Linux) where users were presented with misleading error messages during install. Lastly, the application had to be run with administrative privileges. These factors made it very unlikely for casually interested members of the public from exploring this otherwise public dataset. Our goal for this web application was to make the data as accessible and easy to understand as we could.
The first step of the project was to extract the information from the existing RSEI application. Data in the application was stored in an old format called Paradox DB. Most vendors, including Microsoft through their Access application, had dropped support for Paradox DB several software versions prior. This made it difficult to find ready-made applications that could read and extract the data. The few commercial applications we did find were unable to extract the data in its entirety. After much research, we were able to find some command line utilities that we could compile on a Linux operating system and combine with some custom scripts we wrote in Python to extract the data and reformat it into a usable format for the web. Text files for each facility and for each chemical type were created from this data and placed on our application server.
Project Goals
A major goal for this project, given its limited budget, was to make the web application as reliable and performant as possible. We considered using a database server to store the data and process client requests from the website. However, we decided that given the infrequent updates to the data (yearly at most) and the extra staff time involved in maintaining database servers, that storing the files as static text files preformatted for use in our application would provide the best experience for our users while requiring the least amount of maintenance by our staff. When a user clicks on a facility on the Toxic Trends map, the facility information is returned to the user from our server within 10’s of milliseconds. The cartography for the site was prototyped using ESRI’s ArcMap, but implemented using the open source Tilemill application. This application produced png map tiles of our facilities at every zoom level needed by our application. Again, to ease maintenance costs and to create the most performant application, tiles were stored directly on our web server.
The only dynamic application for the Toxic Trends website is the search functionality, which uses the open source Elastic Search application. All the rest of the files are stored statically and as long as the webserver is operating correctly, remain available. This means there are fewer points of failure in this system requiring significantly less maintenance. At the time of writing, the Toxic Trends server has been operating uninterrupted for 338 days and has required minimal staff time to maintain.
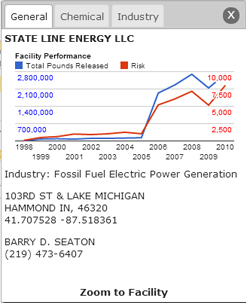
from the Toxic
Trends application. This
profile shows the
emissions and risk
trends of the
State Line Energy
LLC facility
in Hammond, Indiana
The basemap used by Toxic Trends was developed by Stamen, a San Francisco design firm. The basemap was created as part of a grant from the Knight Foundation and is made available for public use. We considered developing our own basemap for the project, but given our budget and time constraints, this beautifully done Stamen map suited our purposes just fine.
The actual web map was coded in Javascript using the Leaflet mapping API. Leaflet is a lightweight but powerful Javascript library to facilitate interactive mapping. We wrote our code to be standards compliant and cross-compatible with most browsers. We made sure to use responsive design techniques so the application looks good and works well on both desktop and mobile devices.
We made great strides for this application to be accessible and easy to use on most devices and in locations where high-speed internet is limited. An initial page load for our application is about 60% smaller than an initial page load on Google Maps when looking at the amount of data transmitted across the internet.
Assistance on the development of the application was made through a grant of $11,344 from the Environmental Council of the States (ECOS). “The Toxic Trends application is an invaluable public tool that allows users to access important industrial chemical information from any internet connected device,” said Bryan Shipley, project manager for ECOS. “We feel the map’s unique visual mapping layout provides an easier method for the public to learn about toxic chemical information and the associated risks within their community.”
The Toxic Trends application can be viewed at http://toxictrends.org.