Spatial Institute Projects
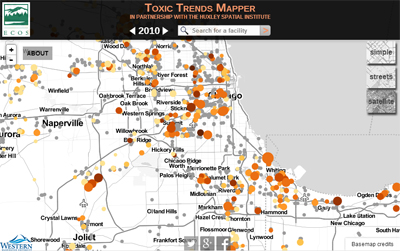
Toxic Release Inventory (TRI) Toxic Trends Mapper
This application combines data from the EPA’s Toxics Release Inventory and the Risk Screening Environmental Indicators program to display air pollution levels for individual facilities on a map of the United States along with their risk-related score, by pollution source. It is designed to provide ordinary citizens with access to toxic pollution data regarding environmental releases from medium to large pollution sources like local refineries and aluminum smelters.
Skewed Riskscape Dynamics and Social Vulnerability in the American Urban System
This ongoing research program offers an expansive investigation of urban riskscapes that includes both natural and social hazards to test the hypothesis that the social and natural hazard burdens are unequal and unevenly dispersed across the U.S. urban system.
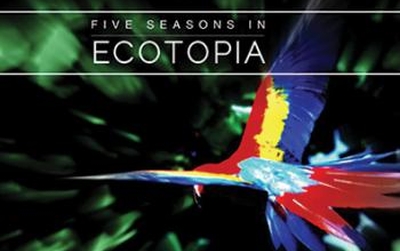
Ecotopia's Prism: Political Biogeography and Costa Rica's Ecology, Economy, and Equity
Over the past five years Dr. Troy Abel has collaborated with Western students, faculty, and Costa Rican’s conserving tropical rainforests. The Rainforest Immersion & Conservation Action Program (RICA) studies ecological citizenship and political biogeography via immersion in some of the most biologically intense places on the planet.
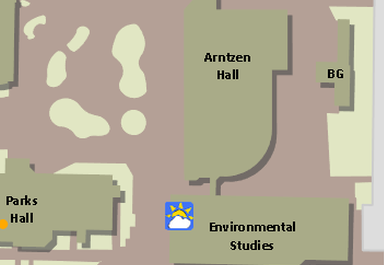
WWU Campus Map
The WWU Campus Map is an interactive map of the Western Washington University Campus.Multiple data layers are incorporated into the map providing access to the campus's features and services.
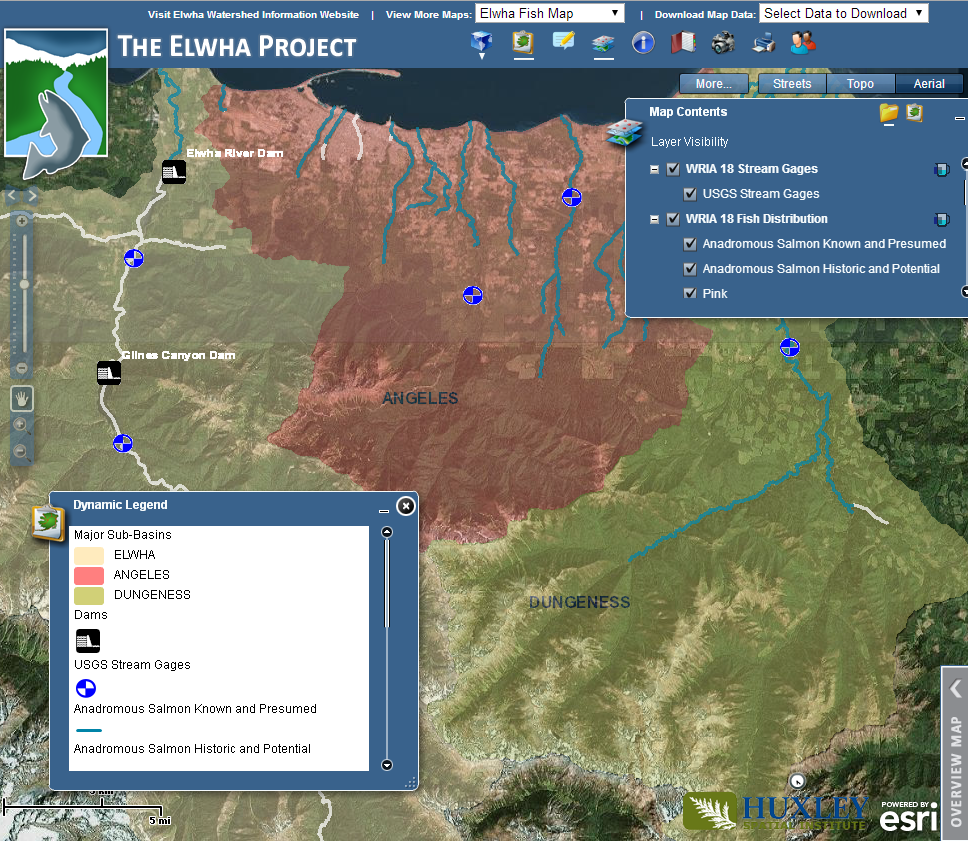
Elwha Watershed Information Portal
The Elwha Watershed Information Resource was developed to support the management and recovery of the Elwha Watershed after dam removal. The Elwha Map provides environmental data (stream gages, water quality, fish distributions, geology, zoning, etc.) for the Elwha watershed.
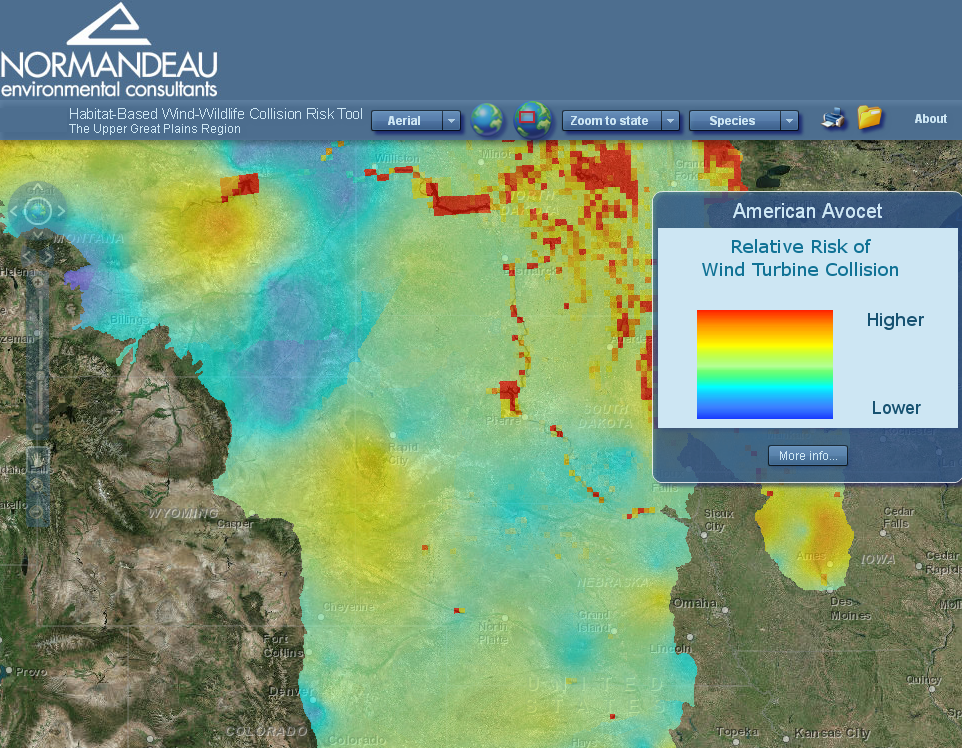
Normandeau Wind-Wildlife Risk Tool
This ArcGIS Viewer for Wind-Wildlife Risk is a user-friendly, web-based interface that allows users to identify the risk of collision with wind turbines for nine species of birds in the mid-western United States.
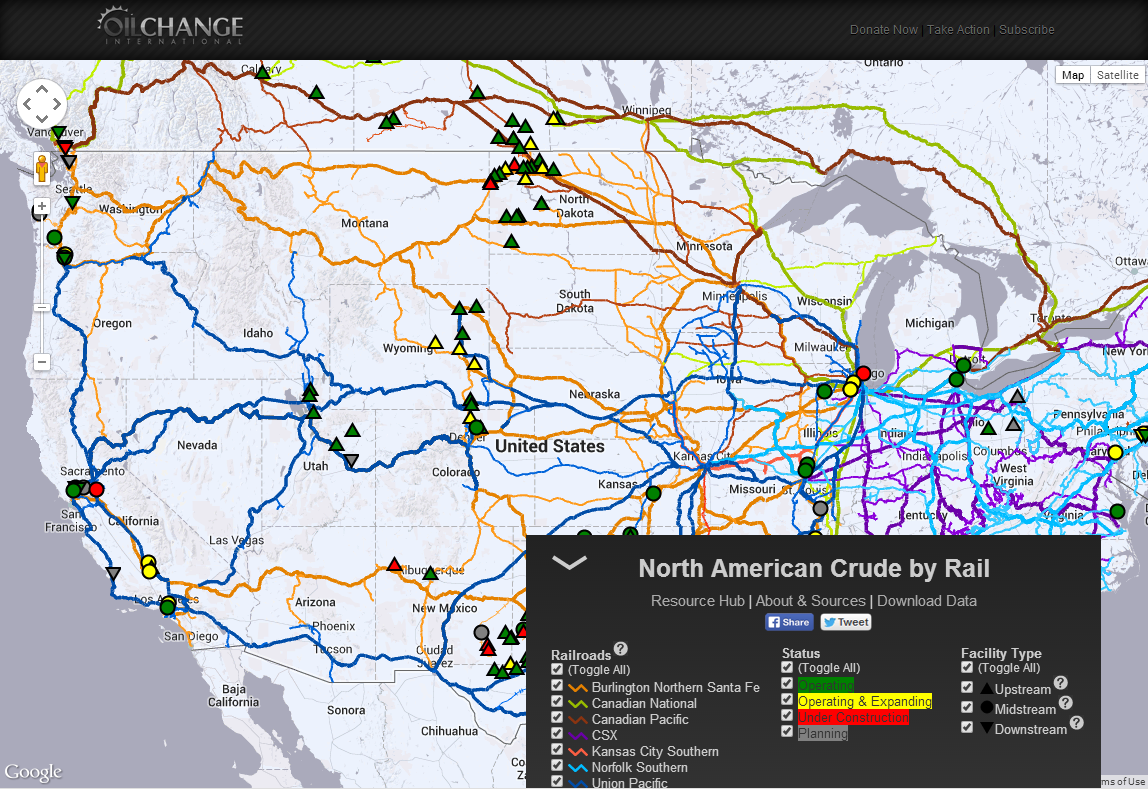
Crude by Rail Map
Jacob Lesser and Tyson Waldo of the Spatial Institute recently completed the Crude-by-Rail Interactive Map, centered on the current rapid expansion of crude oil being shipped by rail in North America.

Macaw Cam: Exploratory Camera Trap Techniques for Monitoring and Conservation of Scarlet Macaw (Ara macao) Nests
In this study, we explored new, low-cost camera trap techniques to monitor Scarlet Macaws in one of their last two self-sustaining habitats in Costa Rica. Camera trap monitors have begun to produce new insights in avian research and we use them not only because Macaws are threatened, but their imagery can be used to enhance the public’s understanding of the connections between science and conservation efforts.
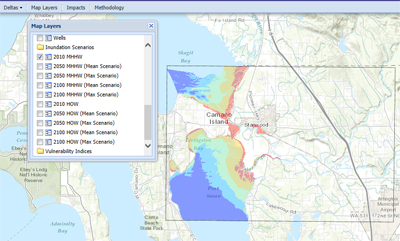
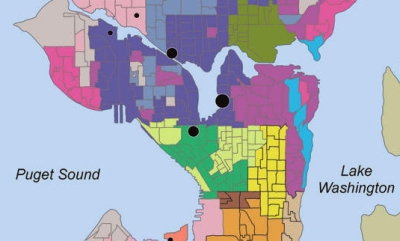
Puget Sound Coastal Resilience Tool
Coastal Resilience is a web-based decision-support tool that combines spatial data on coastal habitat and human communities, allowing users to evaluate vulnerabilities to various scenarios such as sea level rise and coastal storms. The tool provides analyses of impacts from various sea level rise scenarios, such as miles of roads inundated, and includes vulnerability assessments such as mapping low areas in dike systems that may be at risk from overtopping.
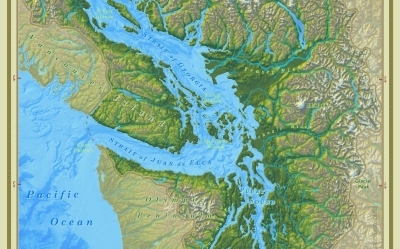
Salish Sea Naming Project (Map)
The name 'Salish Sea' was first proposed by College of the Environment faculty Bert Webber in the 1980's to describe and unite the combined inland marine waters of Washington, USA and British Columbia, Canada. Originally rejected as a new geographic name, the suggestion was reintroduced in 2008 and eventually adopted by the governments of Washington, British Columbia, USA and Canada in 2009. The Salish Sea map was created by Stefan Freelan of the Spatial Institute as part of the 2008 renaming campaign.
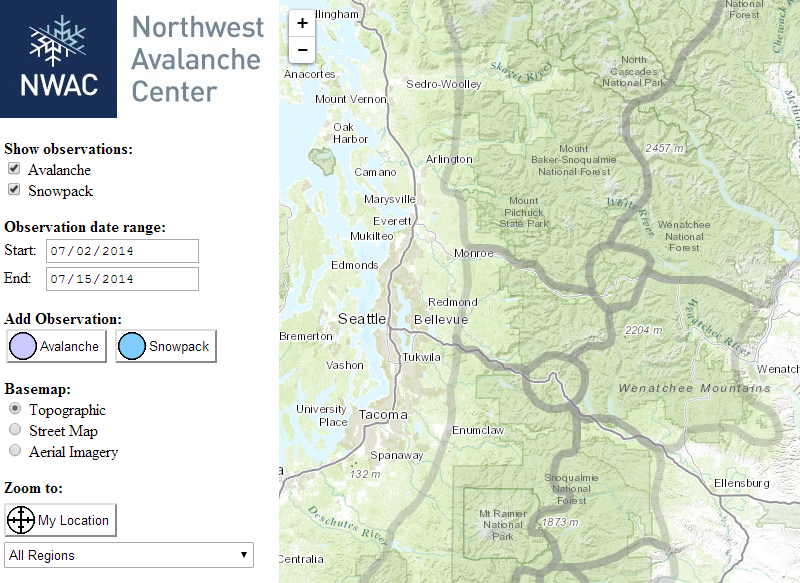
Northwest Avalanche Center
The map viewer and data reporting application for the Friends of the Northwest Avalanche Center. Originally, this application showed the daily avalanche forecasts produced by the Northwest Avalanche Center (NWAC).
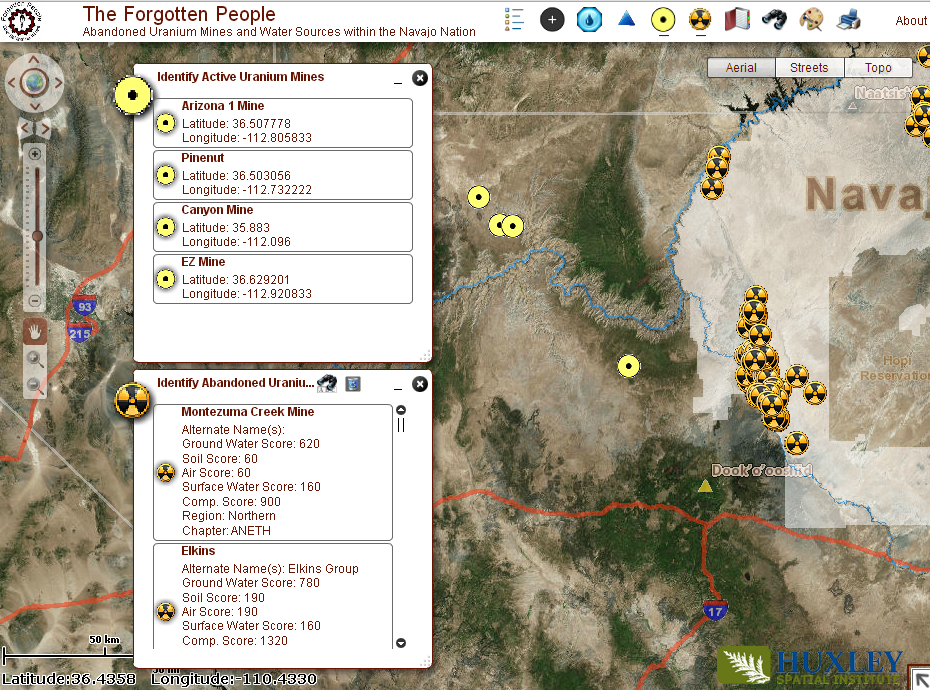
The Forgotten People: Uranium Mines and Water Sources within the Navajo Nation
This interactive web map provides information for some of the environmental features and hazards of the Navajo Nation in the Southwest USA, including Uranium Mines (active and abandoned), coal power plants and water sources.
Where is the College of the Environment
A collection of geographic and historical trivia related to the College of the Environment...